3 Virtual Clinical Trials of BMP4 Differentiation Therapy: Digital Twins to Aid Glioblastoma Trial Design

We leverage an integrative mathematical modeling framework to translate the impact of preclinical findings in virtual clinical trials. We develop a virtual clinical trial pipeline to face the real-world problem of numerous of actual early phase clinical trials that have failed for glioma/glioblastoma, the most common primary brain tumor. Even with the most promising preclinical data, designing clinical trials is fraught with challenges, including controlling for the many parameters used to inform patient selection criteria. Here, we introduce a virtual trial pipeline that allows us to consider the variability from some of these criteria that can be used for future trials of novel therapies. As an example, we apply this to the proposed delivery of BMP4 to stem cell niches present in glioblastoma, the most aggressive glioma, known for its inter- and intra-patient heterogeneity. The proposed approach of BMP4 treatment, delivered through adipose-derived mesenchymal stem cells, aims to promote cellular differentiation away from the treatment-resistance stem cell niches towards a more treatment-vulnerable state. This pipeline will help us narrow down strategies for future trials, optimize timing of treatments relative to key standard-of-care treatments, and predict synergy amongst the developed treatments.
Glioblastoma, Glioma stem cells, BMP4, Mathematical oncology, Virtual clinical trial, Mathematical modelling, Digital twin
3.1 Introduction
Glioblastoma (GBM) is the most commonly diagnosed primary malignant brain cancer in adults. Current standard of care consists of maximal safe surgical resection followed by concurrent radiotherapy and chemotherapy (with temozolomide) (Stupp et al. 2005). Despite this aggressive treatment, outcomes remain poor with median survival of only 15 months (Ostrom et al. 2019). The aggressiveness and fatal outcomes of GBM can be attributed to its highly infiltrative nature and to its vast intra- and inter-patient heterogeneity. Malignant cells can be found infiltrating far into the peritumoral areas of the brain and are undetectable by conventional imaging and operative techniques. Furthermore, tumors contain an array of different cell types with distinct molecular and phenotypic characteristics, hindering therapy efficacy. In particular, previous studies have identified a sub-population of malignant glioma cells with stem-like characteristics known as glioma stem cells (GSCs) or brain tumor initiating cells (BTICs). These cells are highly resistant to both radio- and chemo-therapy and therefore contribute to treatment failure (Bao et al. 2006; Singh et al. 2004). Thus, if treatment outcomes are to be improved for patients with GBM, it is vital that therapeutics that specifically target these GSCs are developed.
The existence of a population of cancer stem cells (CSCs) was first established in leukemia (Lapidot et al. 1994; Bonnet and Dick 1997). More recently CSCs have been identified in many solid tumors including breast, colon and brain (Al-Hajj et al. 2003; Ricci-Vitiani et al. 2007; Ignatova et al. 2002; Hemmati et al. 2003; Singh et al. 2004; Galli et al. 2004). In GBM, cells expressing the CD133 cell surface protein marker (also found on neural stem cells) have been identified as GSCs based on their exclusive ability to commence and support tumor growth (Singh et al. 2004). In addition to being tumor initiating, GSCs are highly resistant to both radio- and chemo-therapy as they are more efficient at inducing repair of damaged DNA (Bao et al. 2006; Tang et al. 2021; Rich 2007; Stiles and Rowitch 2008; Schonberg et al. 2014; Turner et al. 2009; Dirks 2006). Furthermore, they also engage in a synergistic relationship with the surrounding tumor microenvironment (TME) to promote angiogenesis, proliferation, migration, tumor survival, and immune evasion (Ma et al. 2018). Under the brain cancer stem cell hypothesis, it is becoming increasingly clear that while radiation may be transiently effective, treatment ultimately fails in the long run if any GSCs survive (Dingli and Michor 2006).
If, as with normal tissues, cellular phenotypic heterogeneity within tumors can be explained by a hierarchy of differentiation, with only a subset of stem-like cells capable of long-term self-renewal (Carén, Beck, and Pollard 2016), this raises the prospect that signals promoting differentiation could be effective at driving malignant cells to a less aggressive and ideally post-mitotic differentiated state. This differentiation therapy approach has seen success in acute promyelocytic leukemia (APL) where all-trans-retinoic acid (ATRA) can promote differentiation of CSCs and lead to complete remission (De Thé 2018; Yan and Liu 2016). In GBM, bone morphogenetic protein 4 (BMP4), a member of the TGF-\(\beta\) superfamily, has shown potential as a differentiation therapeutic agent. BMP4 has been shown to drive differentiation of GSCs towards a predominantly glial (astrocytic) fate, to reduce GBM tumor burden in vivo and to improve survival in a mouse model of GBM (Nayak et al. 2020; Carén, Beck, and Pollard 2016; Piccirillo et al. 2006). The precise mechanism through which BMP4 acts is unknown but a possible explanation is that it reduces the frequency of symmetric divisions of GSCs (Guerrero-Cázares et al. 2014), and previous mathematical models of differentiation therapy have assumed that differentiation promoters act in this way (Youssefpour et al. 2012; Bachman and Hillen 2013).
Adipose derived mesenchymal stem cells (AMSCs) provide a possible alternative to traditional treatment, as these cells preferentially migrate toward areas of malignancy, and can be utilized to home towards the infiltrating glioma cells (Li et al. 2014; Mangraviti et al. 2016; Pendleton et al. 2013; Smith et al. 2015; Doucette et al. 2011). Additionally AMSCs can be engineered to secrete BMP4 for GBM therapy, and a migration assay showed that compared to controls, engineered AMSCs significantly retained their tropism and preferential migration towards GBM factors (Mangraviti et al. 2016; J. Kim et al. 2020; Guerrero-Cázares et al. 2014; Tzeng et al. 2011). It has been shown that nanoparticle-engineered AMSCs maintain their multi-potency characteristics and release their therapeutic cargo progressively, furthermore systemically-delivered engineered AMSCs can cross the blood-brain barrier and retain their preferential tropism towards gliomas (Mangraviti et al. 2016). Therefore, AMSCs delivery promises the ability to hone in on GSC niches and locally release treatment to these regions. BMP4-loaded AMSCS (BMP4-AMSCs) would theoretically migrate to GSCs, release BMP4, and increase the rate of their differentiation, reducing the number of GSCs and increasing sensitivity to standard treatments.
Clinical trials typically consist of four phases in which a new intervention is investigated in human subjects to determine its safety and efficacy. This system is notoriously resource intensive and inefficient. The average cost per patient is $59,500 and takes more than 10 years, with only 10% of drugs in phase 1 studies eventually approved (Dowden and Munro 2019; Yankeelov et al. 2024). In GBM, the statistics are even worse; multiple recent phase 3 trials have failed to meet their prespecified primary endpoints (Bagley et al. 2022; Reardon et al. 2020; Cloughesy et al. 2020; Weller et al. 2017; Narita et al. 2019; Roth et al. 2021). Of course, there are many reasons for these failures including inter- and intra-patient variability, drug delivery limitations, paucity of control arms, overly stringent clinical eligibility, and beyond (Bagley et al. 2022).
Increasingly, it is being realised that mathematical modelling and in silico clinical trials can assist in addressing a number of these problems. Subfields such as virtual clinical trials (Craig et al. 2023), phase i trials (E. Kim et al. 2016), and digital twins (Wu et al. 2022) have evolved all with the aim to create simulated patients or patient cohorts that can be used as a surrogate to predict the effects of treatment on a more personalized level. This approach has been applied to a variety of cancers, including breast cancer (Wang et al. 2019; Wang et al. 2020), head and neck cancer (Zahid et al. 2021), melanoma (E. Kim et al. 2016), and ovarian cancer (Cardinal et al. 2022). Here, we take a similar in silico approach to glioblastoma and its proposed treatment with BMP4-AMSCs.
3.2 Materials and methods
We use mathematical modelling to simulate GSC-driven brain tumor growth. Our model describes the interplay of GSCs (\(s(t)\)) and non-GSCs (\(v(t)\)). To describe radiation therapy we use the well-established linear quadratic model (R. Rockne et al. 2009; McMahon 2018) with realistic standard treatments (five treatments per week, weekends off, for six weeks) and with tissue-specific radiosensitivity parameters. Following (Bachman and Hillen 2013; Youssefpour et al. 2012) we model differentiation therapy as decreasing the propensity for self-renewal of GSCs.
3.2.1 Pre-clinical data
To quantify the effect of BMP4 on sensitising GSCs, we used data collected from a clonogenic radiotherapy (RT) assay (Farias et al., n.d.). Five GSC cell lines were treated with either complete media (untreated control), BMP4 (100 ng/ml), BMP4-AMSCs conditioned media (100 ng/ml BMP4), or a similar volume of non-engineered AMSC conditioned media for a period of 48 hours, then seeded at 250-1250 cells per well in 96 well plates and treated with 0, 2, 4, 6 Gy of radiation, with six replicates in each case. After 14 days the colonies with more than 100 nm diameter were manually counted.
Typically, the linear quadratic (LQ) model is used to describe the surviving fraction of cells after radiation. However, this assumes only one cell type is present (R. Rockne et al. 2009; McMahon 2018; Yu et al. 2015). In the control case, GSC lines are cultured in stem cell media, so we assume that cells will remain as GSCs unless any BMP4 or other differentiation promoter is present, thus the LQ model is applicable. However, when BMP4 is applied some amount of differentiation of GSCs will take place that explains the increased sensitivity to RT. To get an estimate for the amount of differentiation that took place over 48hr exposure, we fit a dual-linear quadratic (DLQ) model similar to that of (Yu et al. 2015), given by:
\[ \gamma(d) = F \text{exp}(\eta(-\alpha d - \beta d^2)) + (1-F)\text{exp}(-\alpha d - \beta d^2) \tag{3.1}\]
where \(d\) is the RT dose, \(F\) is the fraction of GSCs and \(\eta\) is the protection factor for GSCs that accounts for the fact that GSCs are less sensitive to radiation than other cancer cells; previous experiments have estimated GSC radio-protection to be \(\eta = 0.1376\) (Gao et al. 2013). We infer the radiobiological parameter from the cell line data in the following way. First, we assume that since the GSC lines are cultured in stem cell media no differentiation will take place, therefore we fit the LQ model to the control case for each cell line, assuming the ratio \(\alpha / \beta = 10\) (R. Rockne et al. 2010), to get an estimate for \(\alpha\). These form the cell-line-specific radiosensitivity parameters. Using these parameters we fit the DLQ model to the BMP4 treated survival data, treating \(\alpha\) and \(\beta\) as fixed constants for each cell line from the control case so that we are only fitting for \(F\). This allows us to get an estimate of the fraction of GSCs after 48hrs exposure to BMP4 in each cell line. The fitted \(\alpha\) and \(F\) for all the cell lines are shown in Table 3.1.
3.2.2 Model assumptions and equations
GSCs have unlimited replicative potential.
GSCs are capable of both self-renewing and differentiating. Using the same notation as (Youssefpour et al. 2012) we denote the proportion of GSCs that self-renew by \(P_s\). This does not distinguish between symmetric and asymmetric division, but rather just considers the overall fraction of proliferating cells that self-renew (\(P_s\)) and differentiate (\(1 - P_s\)).
Progenitor cells (PCs) have a limited replicative potential, this ensures that they are not tumor-initiating. Following (Enderling et al. 2009; Gao et al. 2013), the proliferative potential of PCs is set to a maximum of \(n = 10\) divisions. Once PCs have divided \(n=10\) times they become terminally differentiated (TC) and can no longer proliferate.
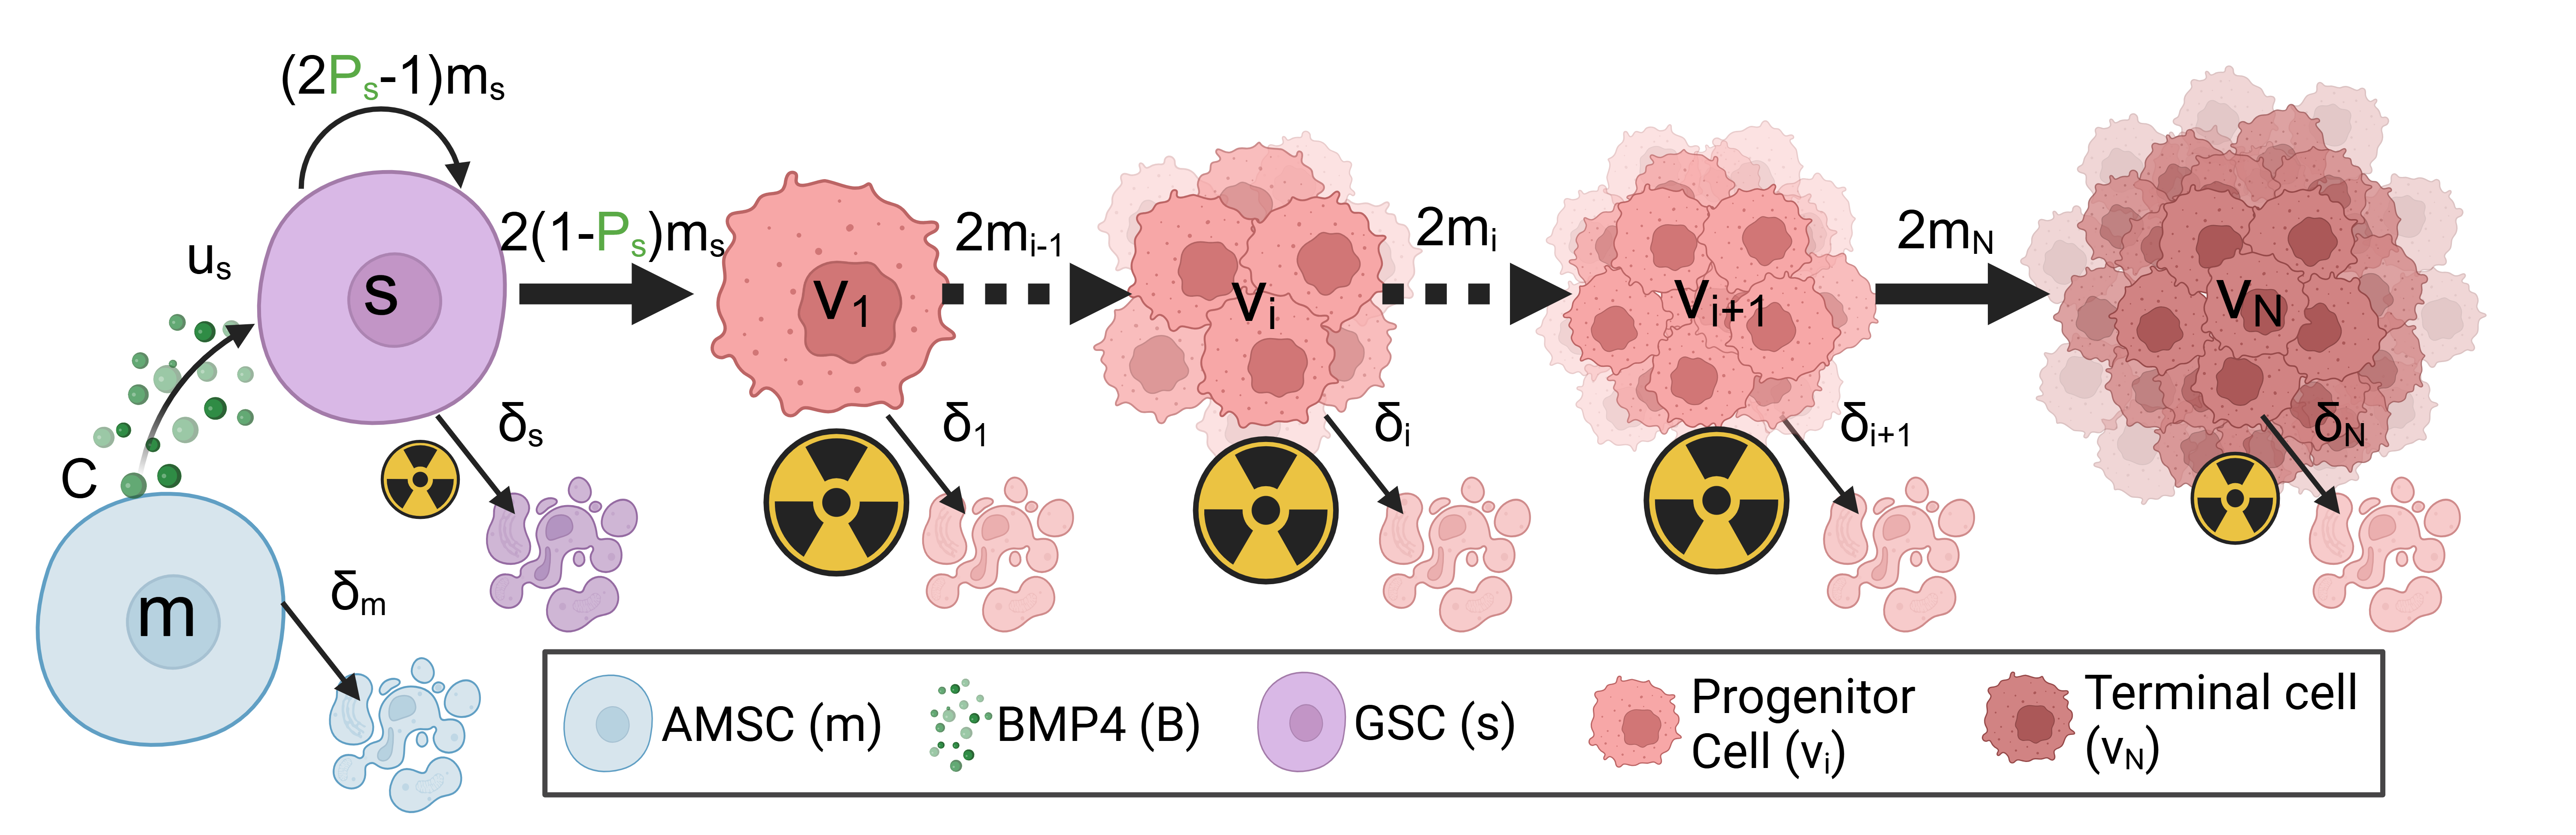
Figure 3.1 shows a schematic of this model. Following these assumptions, we derive the following equations,
\[ \begin{aligned} \underbrace{\frac{d s}{d t}}_{ \substack{\text{Rate of} \\ \text{change GSCs}}} &= \underbrace{(2P_s -1) m_s s \left( 1 - \frac{N}{k} \right)}_\text{Self-renewal of GSCs} - \underbrace{\delta_{s} s}_\text{Apoptosis}, \\ \underbrace{\frac{d v_1}{d t}}_{ \substack{\text{Rate of} \\ \text{change PCs}}} &= \underbrace{2(1- P_s) m_s s \left( 1 - \frac{N}{k} \right)}_{ \substack{\text{Differentiation} \\ \text{of GSCs}}} - \underbrace{m_1 v_1 \left( 1 - \frac{N}{k} \right)}_\text{Proliferation of PCs} - \underbrace{\delta_{1} v_1}_\text{Apoptosis}, \\ \underbrace{\frac{d v_i}{d t}}_{ \substack{\text{Rate of} \\ \text{change PCs}}} &= \underbrace{2 m_{i-1} v_{i-1} \left( 1 - \frac{N}{k} \right)}_{ \substack{\text{Proliferation of} \\ \text{PCs}}} - \underbrace{m_i v_i \left( 1 - \frac{N}{k} \right)}_\text{Proliferation of PCs} - \underbrace{\delta_{i} v_i}_\text{Apoptosis}, \; i=2,...,n-1 \\ \underbrace{\frac{d v_n}{d t}}_{ \substack{\text{Rate of} \\ \text{change PCs}}} &= \underbrace{2 m_{n-1} v_{n-1} \left( 1 - \frac{N}{k} \right)}_{ \substack{\text{Differentiation} \\ \text{of PCs}}} - \underbrace{\delta_{n} v_n}_\text{Apoptosis}, \\ \end{aligned} \tag{3.2}\]
where \(s(t)\) is the density of GSCs, \(v_i(t)\) is the density of PCs (at proliferation level \(i\)) and \(v_n(t)\) are terminally differentiated cells. The total density of the tumor is given by \(N(t) = s + \sum_{i=1}^{n} v_i\). The apoptosis rate for GSCs is \(\delta_s\) and for PCs are given by \(\delta_i\). The proliferation rates of GSCs and PCs are given by \(m_s\), \(m_i\) respectively, where we assume all \(m_i\) are equal. These proliferation rates are subject to a crowding response, represented by the term \(1 - N/k\) where \(k\) is the carrying capacity of the tumor.
3.2.2.1 Differentiation therapy with mesenchymal stem cell delivery model
A possible delivery mechanism for BMP4 is via AMSCs. These could be implanted at the time of resection, or systemically with the ability to cross the blood-brain barrier and subsequently diffuse with preferential tropism towards glioma cells. We model AMSCs as simply decaying exponentially from an initial concentration at implantation. BMP4 is released from these AMSCs and taken up by GSCs. The equations for both the AMSC and BMP4 are thus given by.
\[ \begin{aligned} \underbrace{\frac{d m}{d t}}_{ \substack{\text{Rate of} \\ \text{change AMSCs}}} &= \underbrace{-\delta_m m}_\text{Decay of AMSCs} \\ \underbrace{\frac{d B}{d t}}_{ \substack{\text{Rate of} \\ \text{change BMP4}}} &= \underbrace{C m}_\text{Release of BMP4} - \underbrace{u_sBs}_\text{uptake by GSCs} - \underbrace{\delta_B B}_\text{Decay of BMP4}, \end{aligned} \tag{3.3}\]
where \(\delta_m\) is the decay rate of AMSCs, \(C\) is the rate at which AMSCs release BMP4, \(u_s\) is the uptake rate of BMP4 by GSCs and \(\delta_B\) is the decay rate of BMP4. In vivo experiments have shown that AMSCs can survive for around 14 days in a rodent model and that BMP4 reaches its peak concentration at around 48hrs after initial implantation of AMSC (Li et al. 2014).
3.2.2.2 BMP4 model
Following (Bachman and Hillen 2013), we model differentiation therapy through a simple relationship between the level of differentiation promoter (BMP4), and the probability of GSC self-renewal, \(P_s\), and do not consider the effect of a GSC promoter such as WNT (Lee et al. 2016; Youssefpour et al. 2012). Therefore, the relationship between \(P_s\) and BMP4 is given by
\[ P_s(t) = P_\text{min} + (P_\text{max} - P_\text{min}) \left( \frac{1}{1 + \psi B(t)} \right), \tag{3.4}\]
where \(P_\text{min}\) and \(P_\text{max}\) are the minimum and maximum self-renewal probabilities and \(B(t)\) represents the concentration of BMP4. \(P_\text{max}\) is attained if there is no BMP4 present, while \(P_\text{min}\) is approached as \(B \rightarrow \infty\). We do not consider any endogenous production of BMP4 (or other differentiation promoter), therefore it is only present during differentiation therapy. The parameter \(\psi\) represents the sensitivity of GSCs to BMP4, as \(\psi\) increases (for the same concentration of BMP4) \(P_\text{min}\) is approached faster. Any other potential effects of BMP4, for example on growth rates, are ignored as they are in (Youssefpour et al. 2012) and (Bachman and Hillen 2013).
3.2.2.3 Radiotherapy model
We model the effects of radiotherapy using the linear quadratic (LQ) model, which is widely used in mathematical modelling of RT (R. Rockne et al. 2010; R. Rockne et al. 2009; O’Rourke, McAneney, and Hillen 2009; McMahon 2018). The fraction of cells that survive, \(\gamma_{\text{rad}}(d)\) after a single fractional dose of, \(d\) Grays (Gy) of radiation is given by
\[ \gamma_{\text{rad}}(d) = \text{exp}\left(-\eta \mu (\alpha d + \beta d^2)\right), \tag{3.5}\]
where \(\alpha\) can be interpreted as death from single-stranded breaks (linear component) and \(\beta\) can be interpreted as death from double-strand breaks (quadratic component). It has been shown that the value of \(\alpha\) correlates with the proliferation rate of the tumor. We can use this linear relationship to estimate \(\alpha\) on a patient-specific level as \(\alpha = 0.05m_v\) (R. Rockne et al. 2010). To account for the fact that GSCs are less sensitive to radiation than other cancer cells, we include the additional radio-protection parameter \(\eta\). Previous experiments have estimated GSC radio-protection to be \(\eta = 0.1376\) (Gao et al. 2013; Bao et al. 2006). Additionally, the model contains cells that are terminally differentiated and so do not proliferate. RT primarily targets actively proliferating cells so is less effective against non-proliferating cells. We include \(\mu\) to account for this radio-protection of non-proliferating cells, previous experiments have found this to be around \(\mu = 0.5\) (Gao et al. 2013; Griffin 2006; Potten 1981).
It is assumed that all effects of radiation on tumor cell density are instantaneous, and no delay or otherwise toxic effects of radiotherapy are considered. Nor are any effects on proliferation rate as a result of radiotherapy considered. Therefore, we model the effects of radiotherapy as an instantaneous reduction of tumor density. Considering each compartment of the model (Equation 3.2) separately we modify them by
\[ \begin{aligned} s_\text{post-rad} = s_\text{pre-rad} \text{exp}(-\eta(\alpha d + \beta d^2)) \\ v_{i_\text{post-rad}} = v_{i_\text{pre-rad}} \text{exp}(-(\alpha d + \beta d^2)) \\ v_{n_\text{post-rad}} = v_{n_\text{pre-rad}} \text{exp}(-\mu(\alpha d + \beta d^2)) \end{aligned} \tag{3.6}\]
3.2.2.4 Resection model
Similarly to radiotherapy we model resection as an instantaneous loss of density, applied to each model compartment separately as
\[ \begin{aligned} s_\text{post-resect} = s_\text{pre-resect} \gamma_\text{res} \\ v_{i,\text{post-resect}} = v_{i,\text{pre-resect}} \gamma_\text{res} \\ v_{n,\text{post-resect}} = v_{n,\text{pre-resect}} \gamma_\text{res}, \end{aligned} \tag{3.7}\]
where \(\gamma_{\text{res}}\) is the surviving fraction after resection. Chaichana et al. investigated the efficacy of resection found that on average resection resulted in a \(91.7 \%\) reduction in tumor volume, so we take \(\gamma_{\text{res}} = (1- 0.917)\) (Chaichana et al. 2014).
3.3 Results
We explore the model for a range of different parameter values to help us identify possible strategies for patient selection in early phase clinical trials of BMP4 therapy, as well as explore different delivery schedules, to increase the likelihood of observing successful clinical trials. We parameterise our model to 5 GBM cell lines where we have known doubling times, radiotherapy response, and exposure to BMP4. This allows us to estimate reasonable values of sensitivity to BMP4. We develop a virtual clinical trial pipeline that allows us to assess the likelihood of observing a successful trial for different patient populations.
3.3.1 Simulating radiotherapy experiments
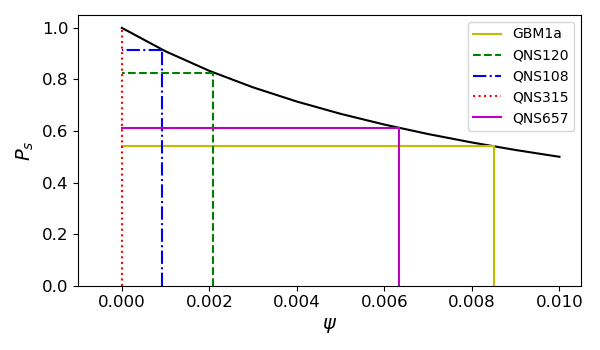
To parameterise the model we simulate the radiotherapy assay described in Section 3.2.1. In the assay a small number of cells were seeded and allowed to grow for 48hrs exposed to either CTRL (GSC media) or BMP4 (100ng/ml) then radiotherapy at 0,2,4,6 Gy was applied. The number of surviving colonies was then counted. To simulate this we initialise our model with a small density of GSCs. The cells are cultured in GSC media in the CTRL case so we assume no differentiation takes place before treatment (i.e. \(P_s = 1\)). We simulate the BMP4 as a constant concentration for the 48hrs. From the DLQ model (Equation 3.1) we have an estimate for what the fraction of GSCs should be after the 48hrs and given that we also have the doubling time for each cell line we can fit the parameter \(\psi\), which tells us the change in GSC self-renewal (\(P_s\)) over the 48hrs.
The fitted \(\psi\) values for each of the 5 cell lines are shown in Figure 3.2 (c) and in Table 3.1. We find that each cell line has a distinct sensitivity to BMP4, in agreement with work in preparation (Farias et al., n.d.) which shows that GBM1a, QNS657 and QNS120 are sensitive to BMP4 while QNS315 and QNS108 are resistant to BMP4 treatment.

| Cell line | \(\alpha\) | F | Doubling time (hrs) | Sensitivity to BMP4 (\(\psi\)) | Sex |
|---|---|---|---|---|---|
| GBM1a | 0.338 | 0.571 | 54.7 | 0.00850409 | Male |
| QNS120 | 0.116 | 0.770 | 43.5 | 0.002094342 | Male |
| QNS108 | 0.151 | 0.949 | 109 | 0.000918066 | Male |
| QNS315 | 0.0841 | 1 | 63.6 | 0 | Female |
| QNS657 | 0.104 | 0.707 | 75.6 | 0.006332659 | Female |
3.3.2 Model simulations
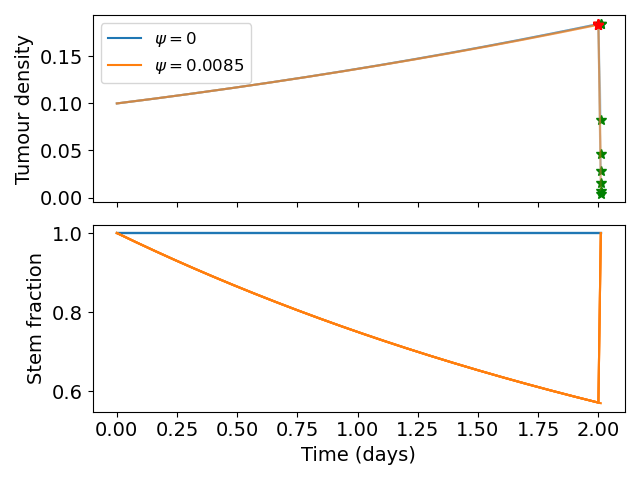
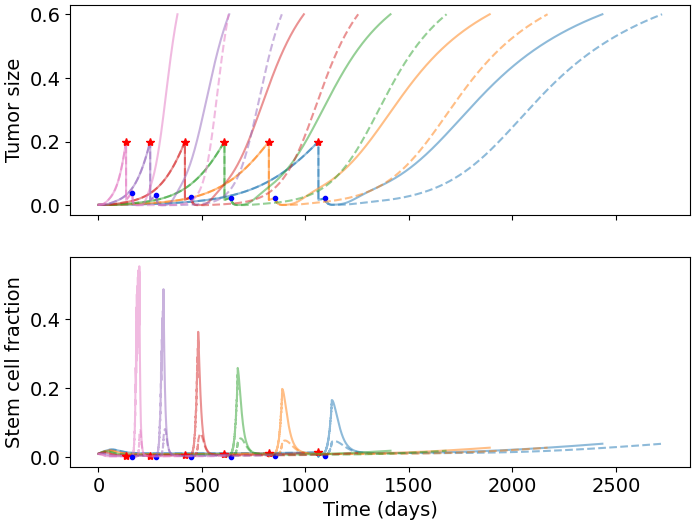
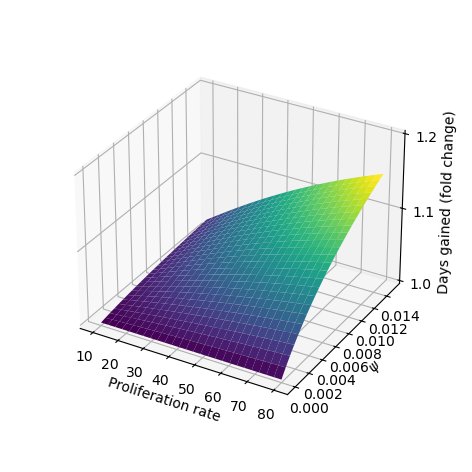
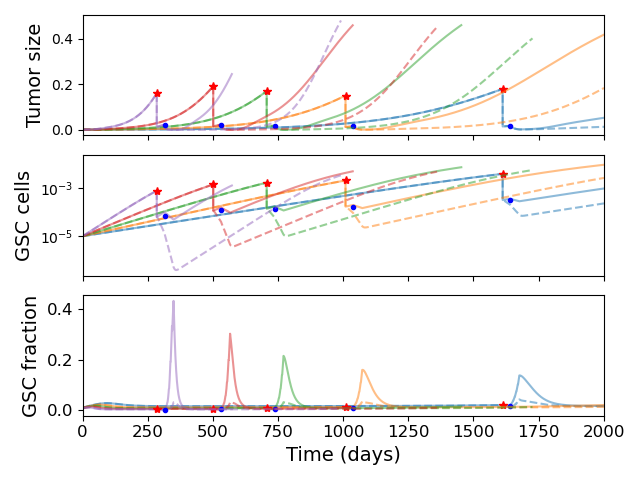
We simulate our model for a range of parameter values to explore the effect of BMP4 on tumor growth. Based on our fitted values of \(\psi\) we consider a range from \([0,0.1]\), the full parameter values are given in Table 3.2. To simulate treatment we allow the model to run until the total tumor size reaches \(0.2\), then initiate treatment. To evaluate the effect of BMP4, we compare two treatment arms: standard of care - resection (at the time of detection) followed by radiotherapy 30 days later, and BMP4 - standard of care with the addition of BMP4. To observe the effect of BMP4, we assume a fixed concentration of AMSCs, which release BMP4 at a constant rate, from the time of resection until the end of radiotherapy. In each case we record the number of days until the tumor reaches a size of \(0.6\) and refer to this as time to progression. This allows us to calculate the fold change in time to progression to directly compare for each set of parameters how much the BMP4 prolonged survival. The results are shown in Figure 3.3 (b).
Since GSCs are less sensitive to RT than other cells, the fraction of GSCs increases during RT; this is shown in our model in Figure 3.3 (a). In particular, radiotherapy is more effective against faster proliferating tumors (R. Rockne et al. 2010) so this effect is particularly pronounced in these tumors. Enrichment of GSCs during RT not only highlights that there are some resistant cells not being targeted by radiotherapy but also since these are the most tumorigenic cells, with a large proportion of GSCs, a recurrent tumor is able to form rapidly (as compared to not at all if no GSCs were present). When we simulated the addition of BMP4 (the dashed lines in Figure 3.3 (a)) we see that this peak in stem-cell fraction is reduced due to the induced differentiation of GSCs. This means that not only is the RT more effective as there are fewer resistant GSCs but also that the tumor will take longer to recur as there are fewer GSCs to drive regrowth. As the increase in GSC fraction is most pronounced in faster proliferating tumors, we see that the relative effect of BMP4 in delaying progression is also largest for these patients.
| Parameter | Meaning | Value / distribution | Units | Reference |
|---|---|---|---|---|
| \(\delta_s\) | death rate of GSCs | 0.001 | 1 / year | Estimated |
| \(\delta_i\) | death rate of PCs | 0.01 | 1 / year | Estimated |
| \(\delta_n\) | death rate of TCs | 0.1 | 1 / year | Estimated |
| \(\delta_m\) | death rate of AMSCs | 0.5 | 1 / year | (Li et al. 2014) |
| \(\delta_B\) | Decay rate of BMP4 | 0.5 | 1 / year | (Li et al. 2014) |
| \(u_B\) | Uptake rate of BMP4 | 0.5 | 1 / year | Estimated |
| \(C\) | Release rate of BMP4 from AMSCs | 0.5 | 1 / year | Estimated |
| n | Number of division of PCs | 10 | - | (Gao et al. 2013) |
| \(m_i\) | Proliferation rate of PCs | \(\text{log-N}(2.75,0.51)\) | 1 / year | (Yang et al. 2019) |
| \(m_s\) | Proliferation rate of GSCs | \(0.0345 m_i\) | 1 / year | Estimated |
| \(\alpha\) | Radiosensitivity | \(0.05 m_i\) | 1 / Gy | (R. Rockne et al. 2010) |
3.3.3 Virtual clinical trial pipeline
Firstly we simulate a large cohort of virtual patients with fix sensitivity to BMP4 based on the parameters identified in Section 3.3.1. We compare our simulated BMP4 patients to virtual controls to show that BMP4 can delay tumor growth. We then develop a pipeline for simulating early-phase 2 clinical trials and calculating the probability of observing a successful trial.
3.3.3.1 Uncertainty in tumor detection and death
We assume that both detection of the tumor and death depend on tumor size in a random fashion for each virtual patient. Detection (death) is more likely the bigger a tumor is, but two tumors of equal size in two patients do not necessarily lead to detection (death) at the same times. Thus, we assume that the times of tumor detection and death, represented by the random variables \(T_{\text{detect}}\) and \(T_{\text{death}}\), depend on total tumor density \(N(t)\) according to the hazard function
\[ P(T_d \in [t,t+\Delta t) | T_d>t) = \lambda_d (N(t)) \Delta t + o(\Delta t), \quad d \in \{\text{detect},\text{death}\}, \tag{3.8}\]
where
\[ \lambda_d (N) = \frac{\lambda_{d,\text{max}}}{1 + e^{-m_d(N - N_d)}}. \tag{3.9}\]
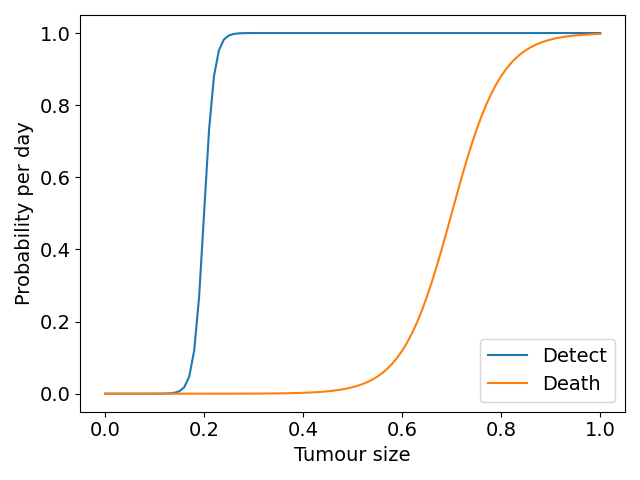
Here, \(\lambda_d(N)\) is a shifted logistic function; \(\lambda_{d,\text{max}}\) is the maximum rate of detection that we take to be 1, \(m_d\) describes the steepness of the logistic function, which we set to be 100 in the detection case and 20 in the death case. The constant \(N_d\) is a threshold parameter at which the probability rate of detection or death is half-maximal (each of these for \(d\in\{\text{detect},\text{death}\}\)), we set this to be 0.2 and 0.7 in the detection and death cases respectively. \(\Delta t\) is the timestep on which the model is solved numerically. This is similar to the approach of (Bartoszyński et al. 2001; Plevritis et al. 2006), apart from our choice of nonlinear dependence on tumor size. The shifted logistic function acts as a switch mechanism, meaning once \(N > N_d\) the rate of detection or death rapidly increases towards its maximum. Figure 3.4 (a) shows the form of these functions with the parameters used in the virtual trials that follow.
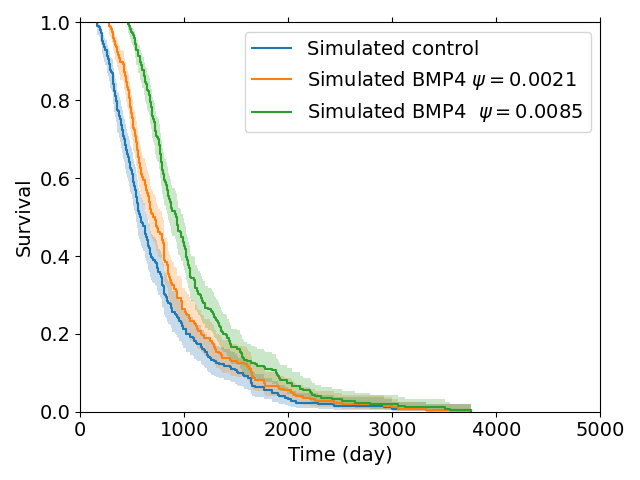
3.3.3.2 Simulated control virtual patient population
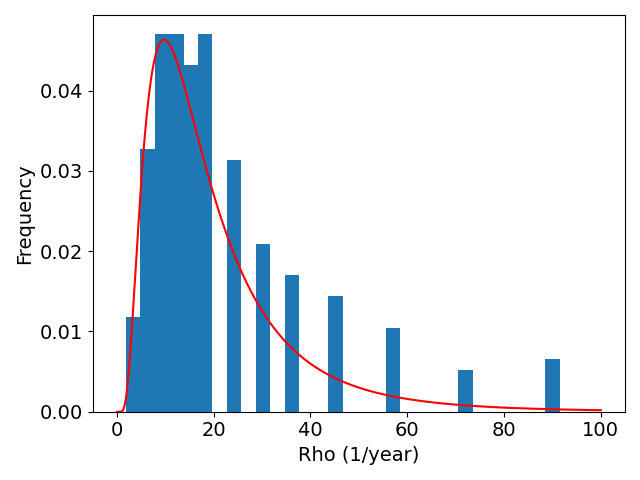
To construct a group of control patients, we sample proliferation rates from a distribution consistent with measured proliferation rates of around 300 patients (Yang et al. 2019), from this distribution we sample 200 patients. We then simulate these patients undergoing resection and radiotherapy (standard of care); to consider the effect of BMP4 on survival we assume a constant concentration of 100ng/ml is maintained from detection until the end of radiotherapy and we consider two different sensitivities \(\psi = 0.0021\) and \(\psi = 0.0085\), these values correspond with the cell lines QNS120 and GBM1a from Table 3.1. The results are shown in Figure 3.4. We see that BMP4 improves simulated survival times and that as the sensitivity to BMP4 is increased the response is more pronounced.
3.3.3.3 Simulated phase 2 trial
In practice a phase 2 trial will have only a small number of patients (typically around 20-40) and the population will be heterogeneous with respect to sensitivity to BMP4. We develop a virtual trial pipeline to consider the chance of observing a successful trial for different virtual populations. We have previously observed that proliferation rate can impact the efficacy of BMP4 treatment (Figure 3.3 (b)). Therefore, we consider 3 stratifications of the population based on proliferation rate. We construct these by sampling twice as many virtual patients as we need for each trial (80) and then splitting them into either the top 50% fastest proliferators, the middle 50%, or the slowest 50%, so that each group has 40 virtual patients. We then split them via a stratified random split, so that both groups have similar distributions of proliferation rates, into control and treatment arms (20 in each), with parameters drawn from Table 3.2 and \(\psi\) from a truncated normal distribution. This assumes knowledge of growth rates for patients enrolled in the trial, which is straightforward for our simulated virtual patients. For each group (fast, medium, slow) we perform 20 virtual trials, each one comprising a distinct set of 40 patients, giving us an idea of the chance of observing a successful trial.
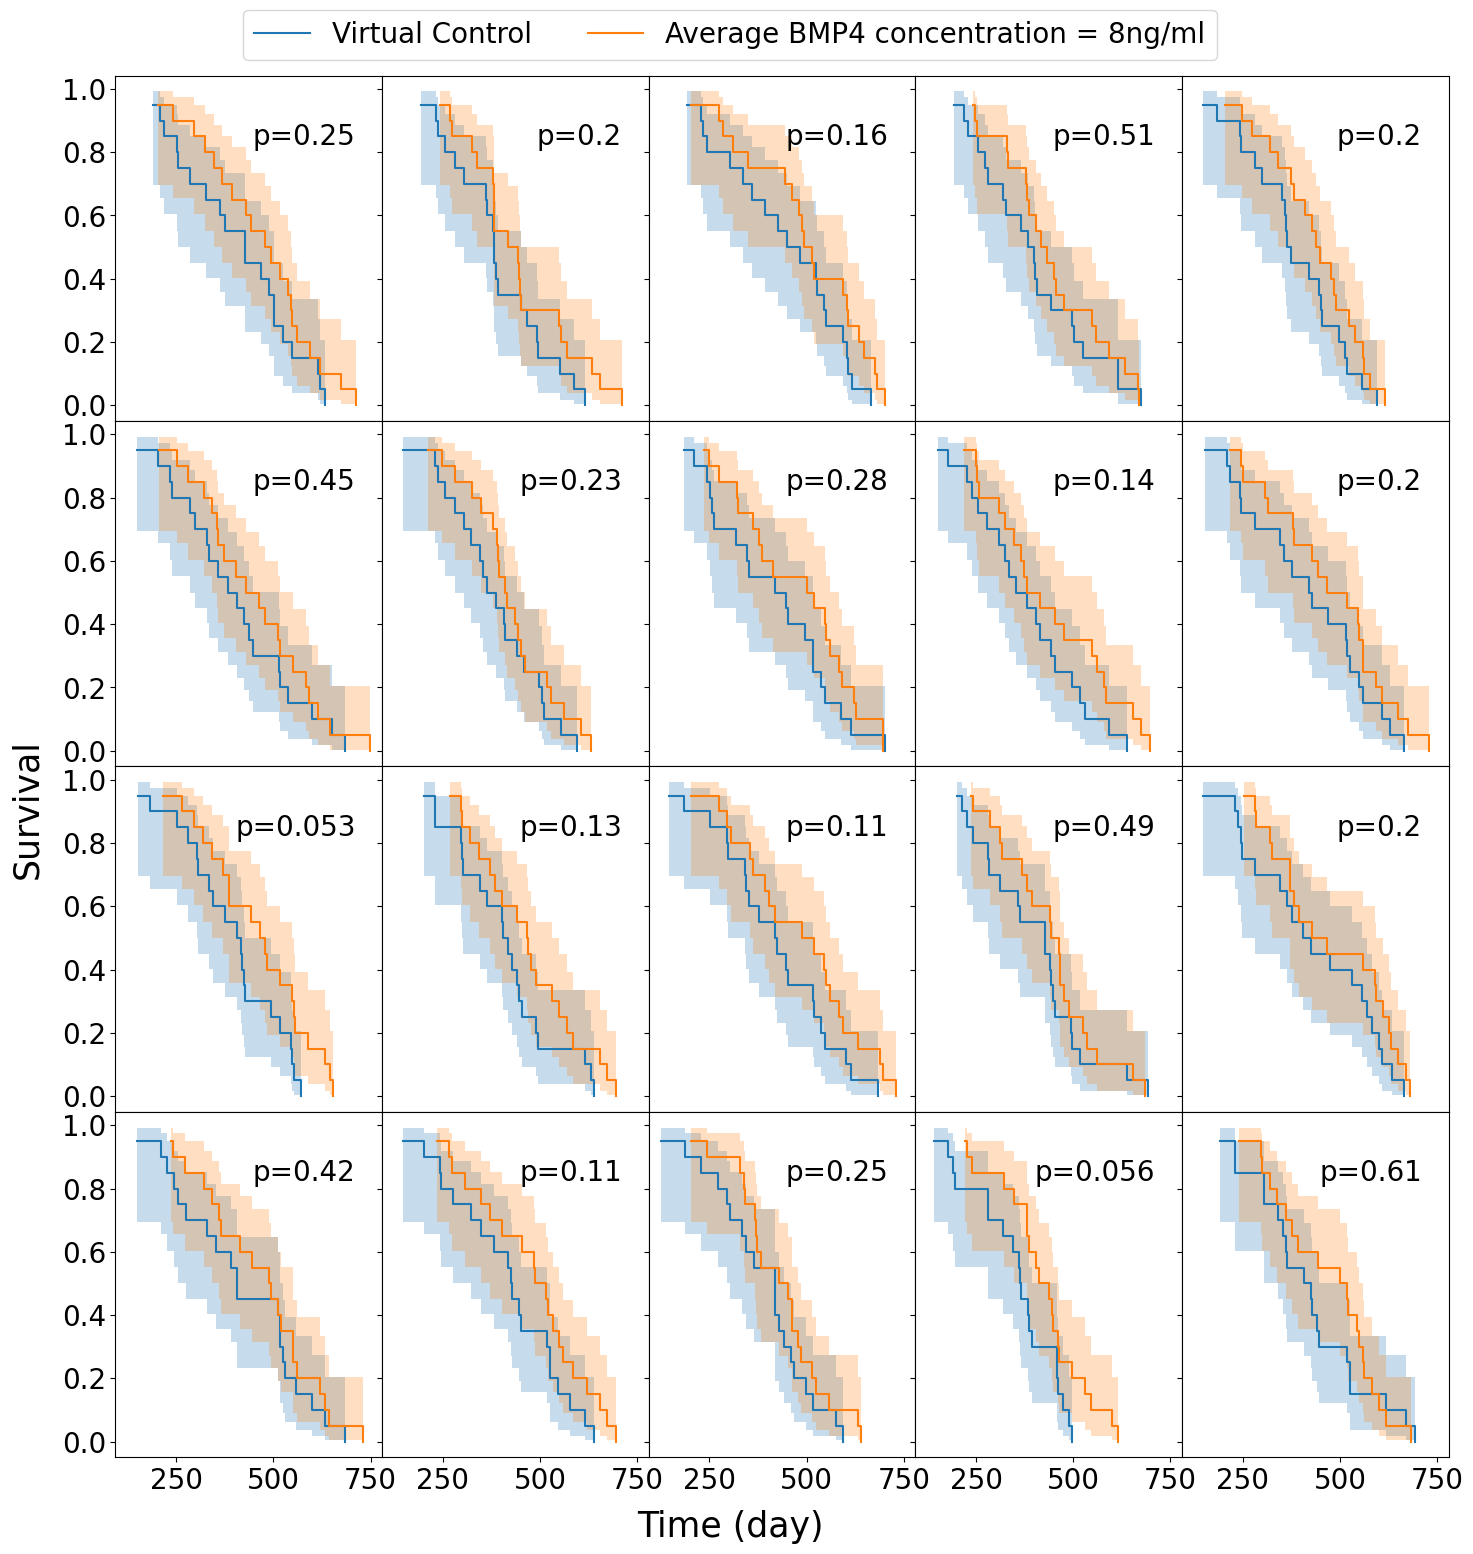
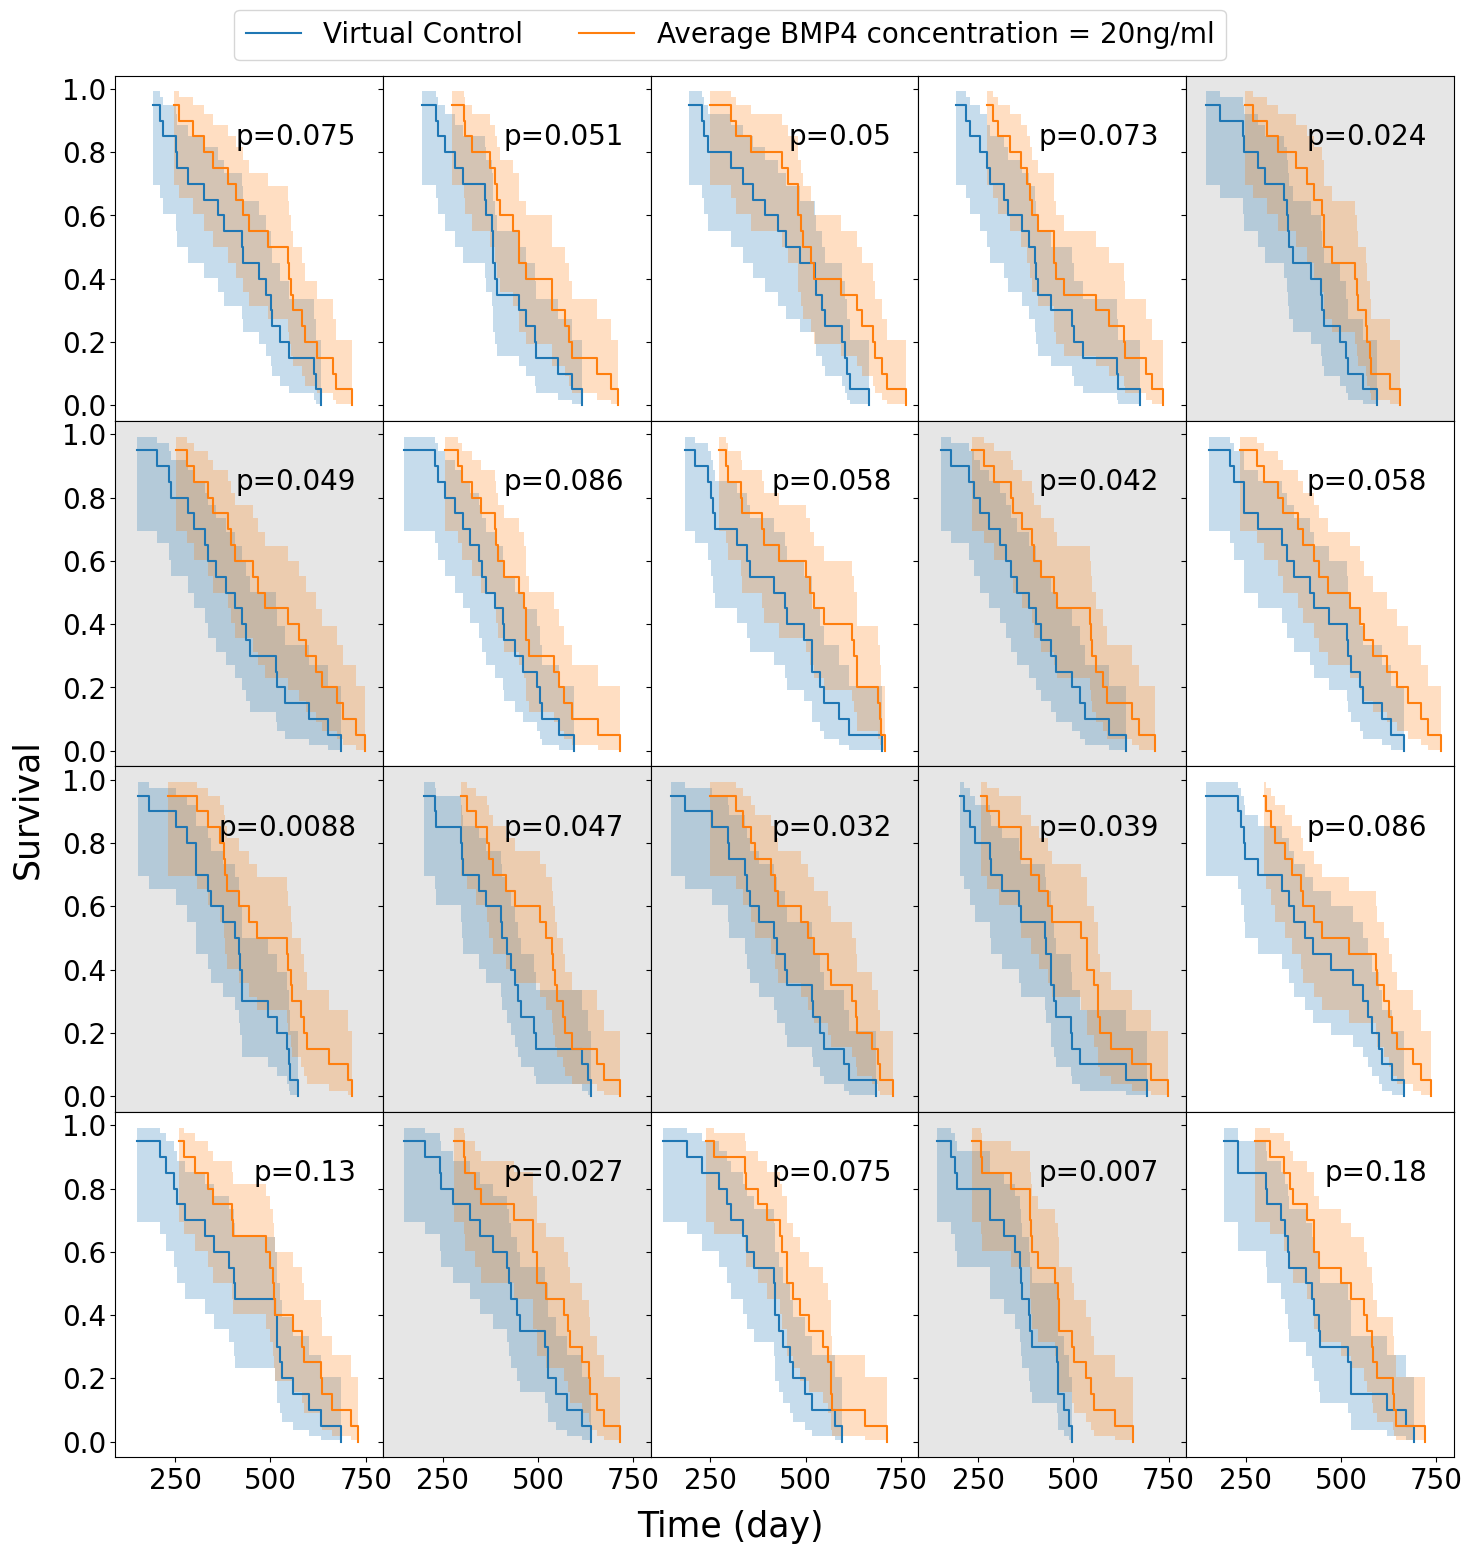
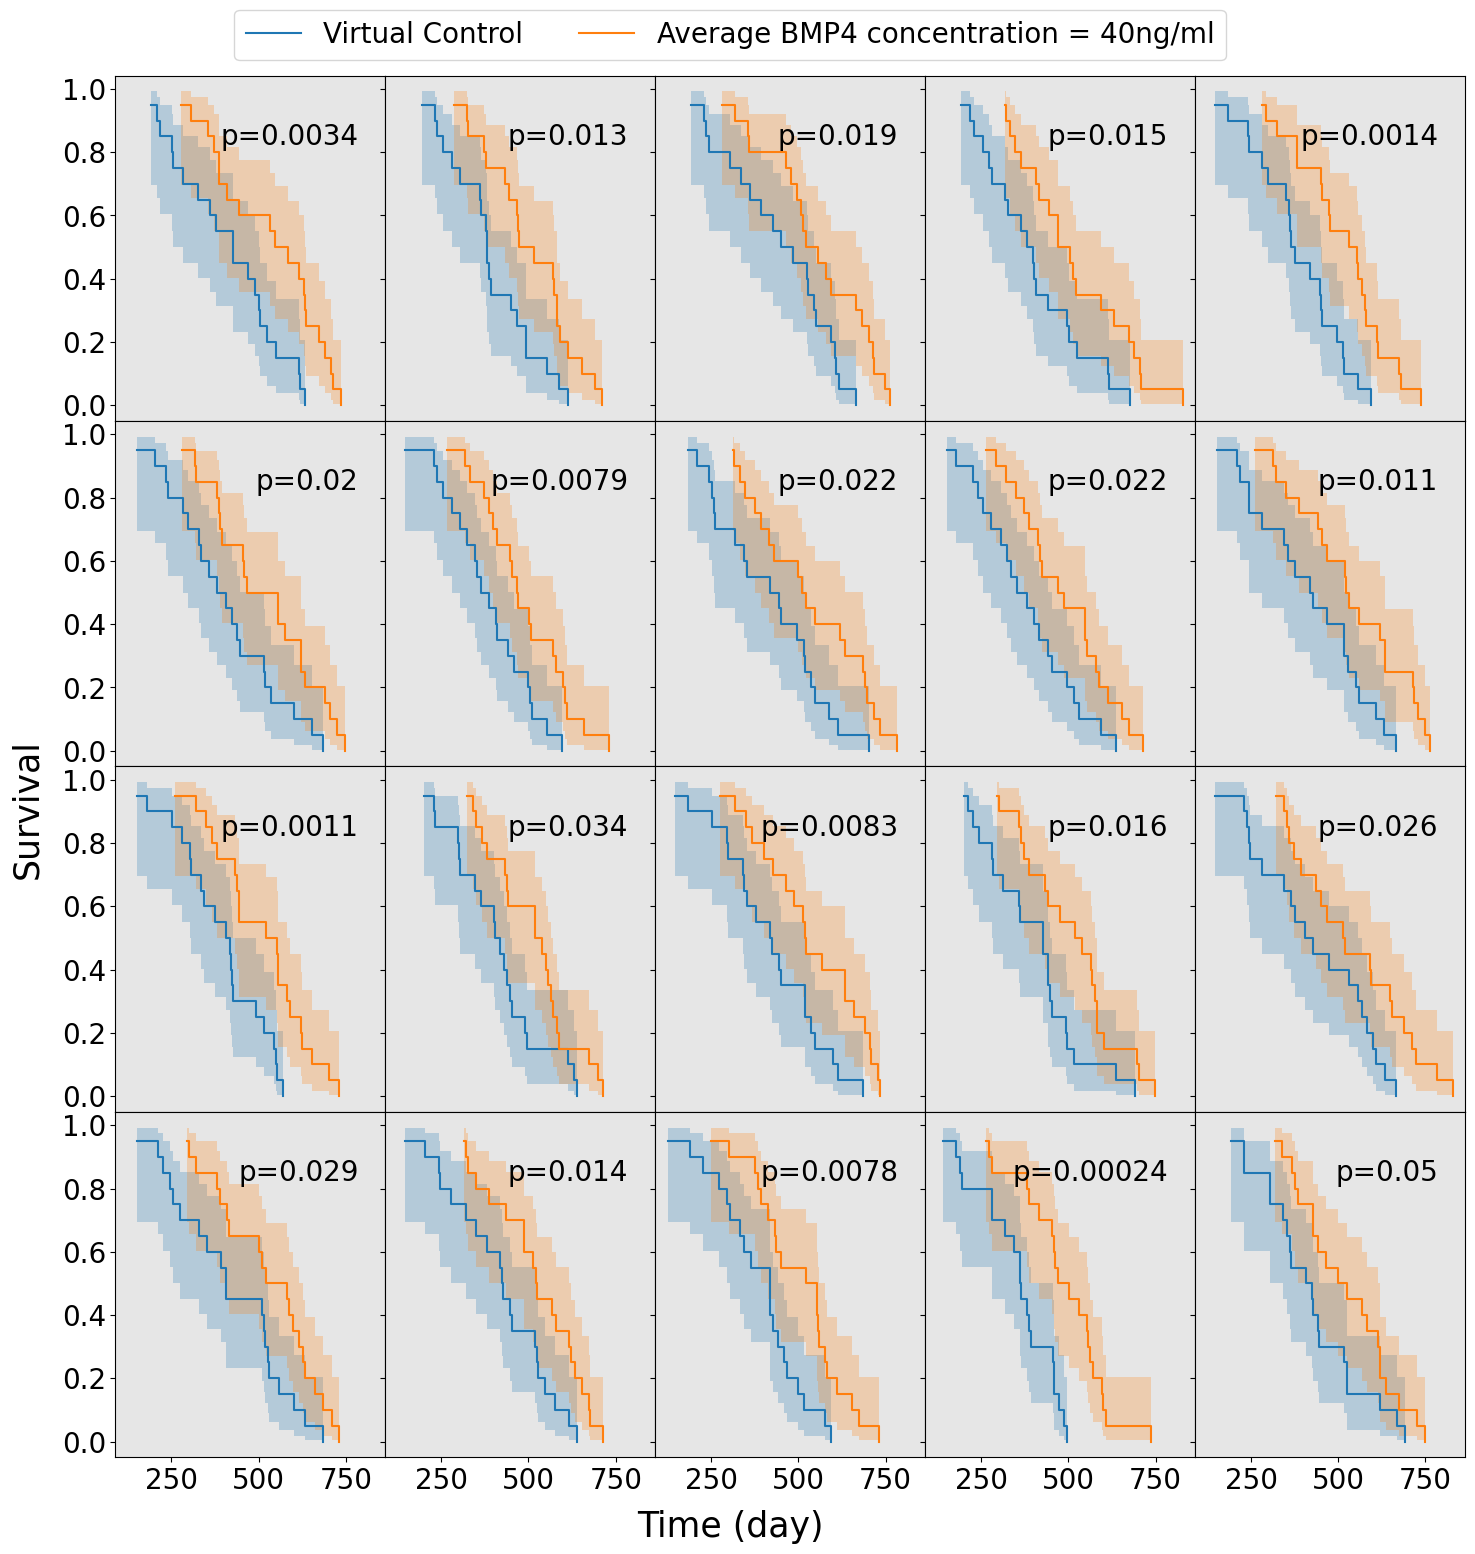
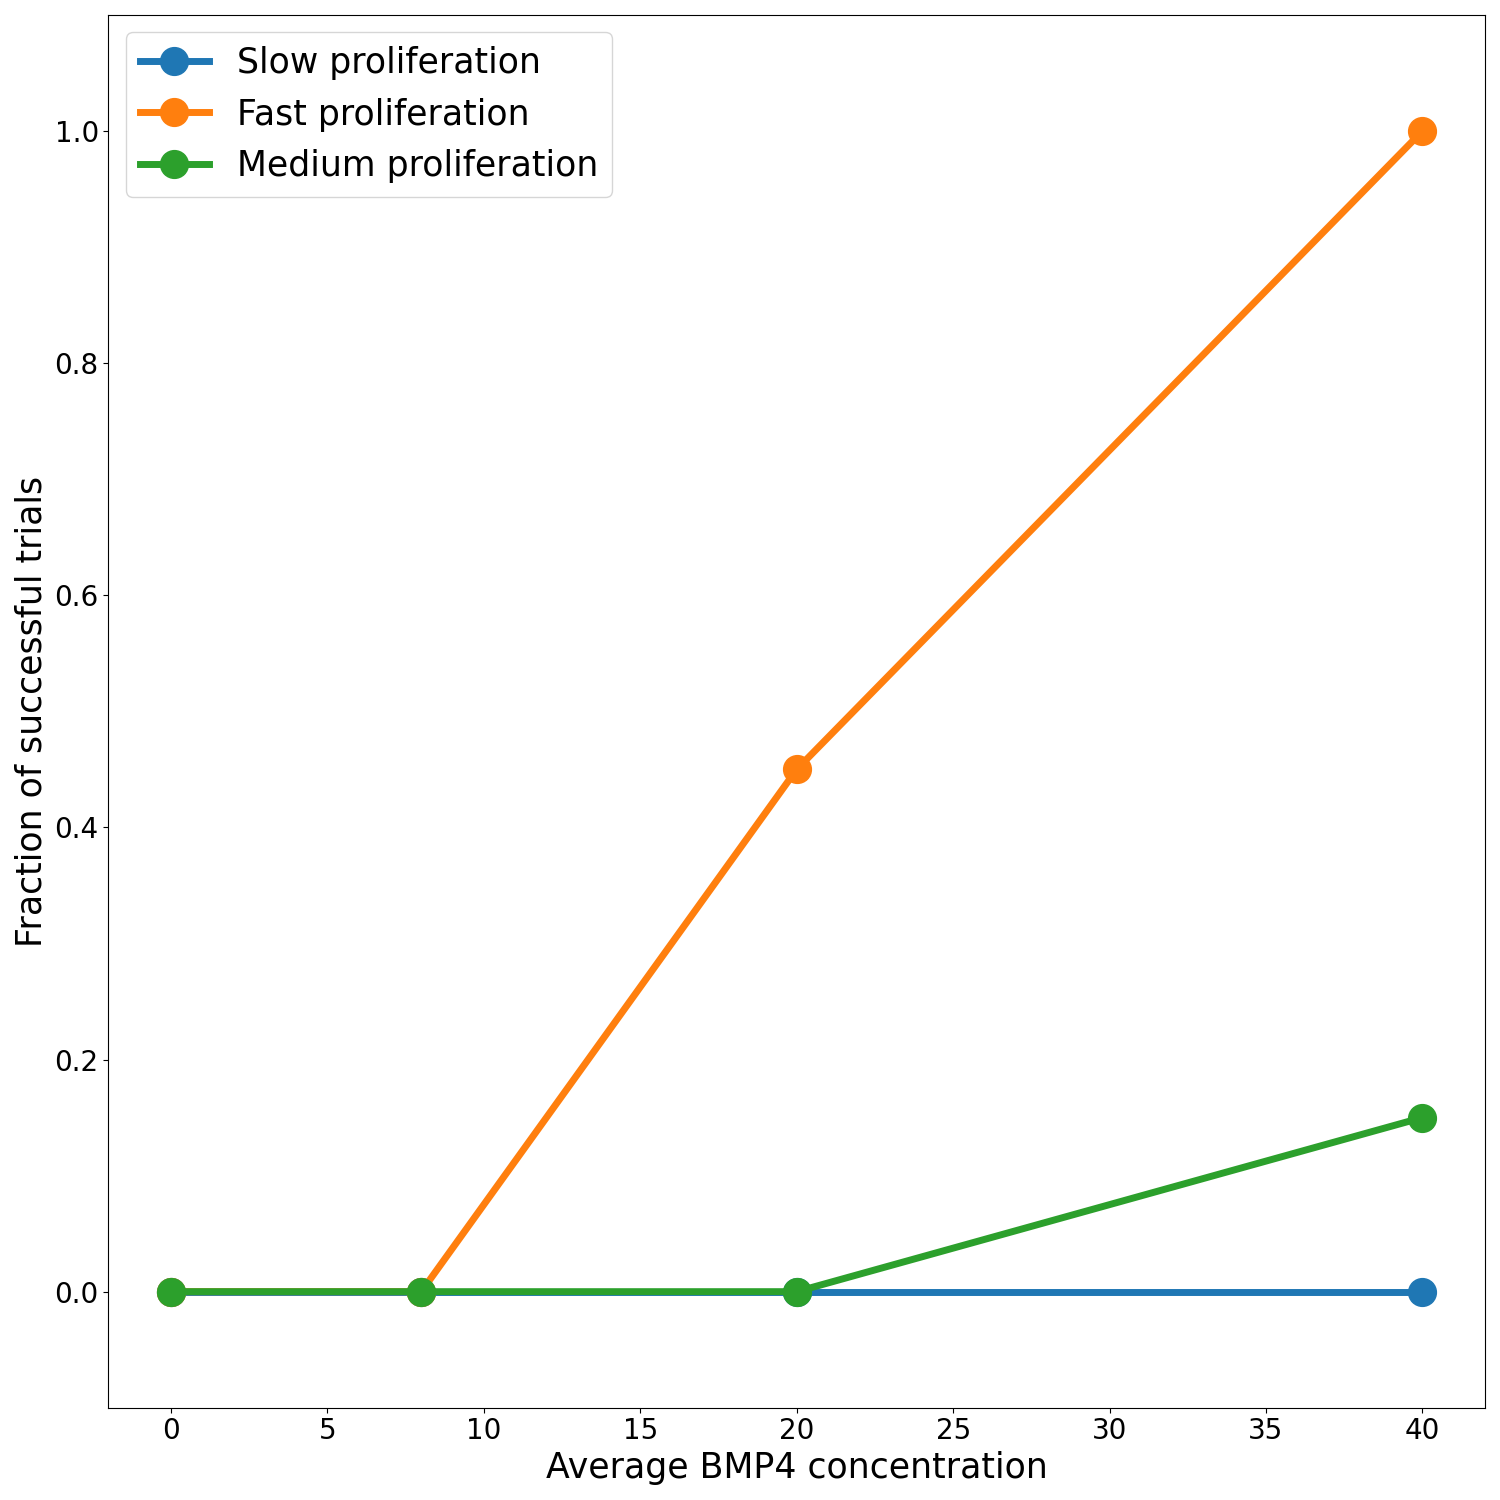
We assume a distribution of sensitivities drawn from a truncated normal distribution with mean sensitivity \(\psi_\text{mean} = 0.0085\), so that, according to our model fits this would be a population that has been identified as highly sensitive to BMP4. For this cohort of virtual patients we consider a possible delivery schedule of BMP4-AMSCs which we shall term ‘single-hit’, this consists of a single dose of AMSCs-BMP4 at the time of resection. This is a promising and practical option for BMP4-AMSCs delivery as they can be implanted directly into the tumor at the time of resection and means the patient is receiving some treatment in the time between resection and radiotherapy, when typically they receive none during this time. For this cohort of virtual patients, we implement a series of different concentrations of AMSCs-BMP4; in Figure 3.5 we show average BMP4 concentration in ng/ml, to compare this to the radiotherapy assay in Section 3.3.1. An average concentration of 8ng/ml corresponds to a peak of 100ng/ml at the time of resection, the same concentration maintained for two days in the assay. We see that, for peak concentrations of BMP4 similar to that in the in vitro assay, no trials show statistically significant differences in survival curves (log-rank test, \(p>0.05\)). Indeed, according to these results a considerably higher total dose of BMP4 is required in order to see consistently successful trials (defined as rejecting the null hypothesis of identical survival curves between control and treatment arms). This may be because of the relatively rapid decay of AMSCs and BMP4; if ASMCs are delivered at the time of resection very few remain and BMP4 concentrations are low by the time RT begins.
The results plotted in Figure 3.5 are for the group of fast proliferators only as this was the only group which saw a significant response to BMP4 therapy. Figure 3.5 (d) shows a summary of the results for all the proliferation groups. This highlights the importance of considering other patient specific parameters when selecting potential patients for clinical trial.
3.3.3.4 Different delivery schedules for BMP4
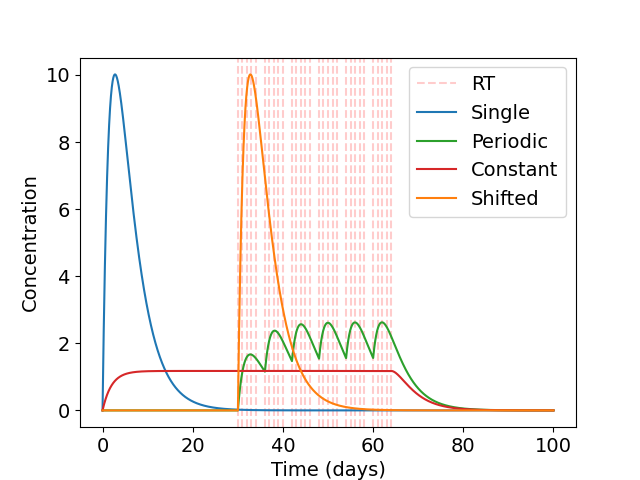
The high concentrations of BMP4 required in a single-hit approach identified in Section 3.3.3.3 motivates us to look at alternative dosing strategies, where similar or greater benefit may be observed for less average dose of BMP4. As the AMSCs only last for around 2 weeks (and BMP4 slightly less) only a small concentration is left by the time radiotherapy occurs in the single-hit approach. Since BMP4 increases the radiosensitivity of the tumor and reduces the enrichment of GSCs when radiotherapy occurs, delivering it in combination with radiotherapy may provide significantly improved responses even when a similar total dose of BMP4 is considered. Therefore, we consider 3 alternative treatment schedules: i) a single dose immediately before radiotherapy, ii) a continuous dose from resection until the end of RT and iii) periodic doses in combination with radiotherapy. These schedules are shown in Figure 3.6 (a). In all cases, the same total dose of BMP4 (this corresponds to the same area under the curve in Figure 3.6 (a)) will be administered so the comparison is fair between delivery schedules.
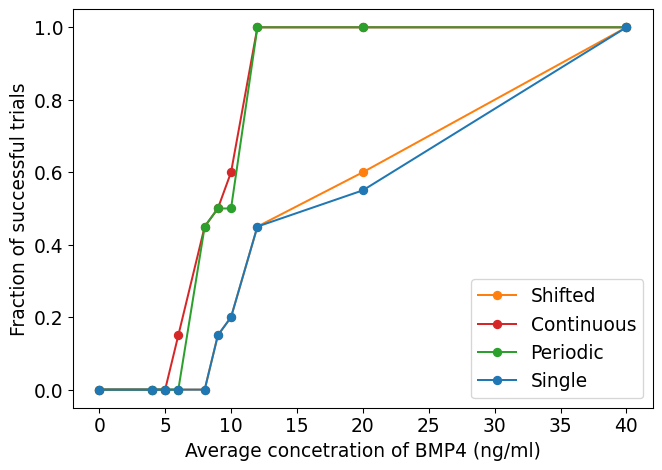
We use the same virtual trial pipeline outlined previously in Section 3.3.3, applied to these three alternative dosing strategies. A summary of the results for the fast proliferating group is plotted in Figure 3.6 (b). We see that the continuous delivery schedule is the most effective, with the highest number of successful trials with an average BMP4 concentration of around 10ng/ml required for almost all trials to be successful. This is closely followed by the periodic schedule. The shifted single dose appears to be largely similar in efficacy as the single dose at resection. These show that longer term exposure of BMP4 greatly increases its efficacy. This highlights the importance of designing the delivery schedule of BMP4 to maximise the effect of the treatment, and in future could be optimised on a patient-specific level.
3.4 Discussion
In this study, we have developed a comprehensive mathematical model to simulate GSC-driven tumor growth, specifically focusing on the impact of BMP4 treatment. By parameterizing our model using experimental data from five distinct glioma stem cell lines exposed to BMP4, we were able to qualitatively estimate the sensitivity of these cell lines to BMP4. This approach provides valuable insights into the potential variability in treatment response among different glioma cell populations.
A key limitation of our model lies in the inherent assumptions necessary for reducing the complex biology of glioblastoma/glioma to a system of ordinary differential equations (ODEs). While our model successfully encapsulates many aspects of tumor dynamics, it does not explicitly account for the spatial heterogeneity of glioblastoma. Future work could expand this model to incorporate spatial considerations, to better capture the intricate microenvironment and its influence on tumor behaviour. That said, we hope that capturing the essence of the proposed BMP4 treatment in the current model has highlighted key mechanisms by which impact on tumor growth may or may not be seen in the clinic.
Moreover, our study primarily concentrated on the impact of BMP4-induced differentiation on radiosensitivity, leaving the direct effects of BMP4 on proliferation rates as an area for further exploration. Understanding how BMP4 modulates proliferation, in addition to differentiation, could provide a more comprehensive picture of its therapeutic potential and guide the development of more effective treatment strategies.
Importantly, we have also demonstrated a virtual clinical trial pipeline to evaluate the potential of BMP4-AMSCs treatment for patients with GBM. Our simulations revealed that a significant amount of BMP4 would be required to achieve successful outcomes in a substantial proportion of patients. This finding underscores the importance of optimizing BMP4 dosage and delivery methods for future clinical applications. Additionally, our results suggest that patient stratification based on proliferation rates could enhance the likelihood of treatment success. By selecting patients with higher proliferation rates, we could potentially increase the observed efficacy of BMP4 in combination with radiotherapy.
Furthermore, we explored various BMP4 delivery schedules and identified that alternative strategies could enhance the therapeutic synergy between BMP4 and radiotherapy. These findings indicate that the timing and duration of BMP4 administration, in particular in relation to the timing of radiotherapy, can be crucial factors that could be optimized to improve clinical outcomes. We have shown that prolonged exposure to BMP4 greatly increased it efficacy when compared to a ‘single-hit’ approach. Future studies could expand on this by investigating different delivery modalities and schedules, potentially in combination with other therapies, to maximize the therapeutic benefit of BMP4.
In conclusion, our work provides a robust framework for virtual clinical trials, offering valuable predictions that can guide the clinical translation of BMP4-based therapies for GBM. By highlighting the need for high BMP4 levels, patient stratification, and optimized delivery strategies, we have laid the groundwork for future studies that can further refine and validate these approaches in a clinical context.